DCM Logic’s poster on its BoilerMaestro boiler controller won Best Poster at the NE Biomass conference in Burlington, VT. The BoilerMaestro is the first controller for boilers of any fuel type to focus on, define, and measure performance of the boiler plant.
Category: News & Updates
-
The BTU Meter Data Logger
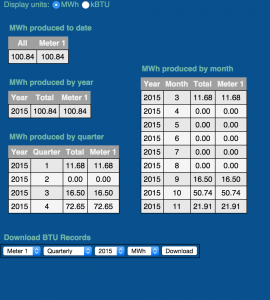
If you’re earning Thermal Renewable Energy Credits (T-RECs) in New Hampshire, you’ll need to comply with the recordkeeping requirements of PUC 2506.04(c). DCM Logic’s BTU meter data logger does that in a one-step download.
-
BoilerBrowser Updates 3/31/2014
As you may have noticed already, we’ve been busy making changes to our BoilerBrowser. In the past week or so, we have revamped the graphics so that you can zoom in/out in a graph with a click and drag of the mouse and we’ve updated the menus.
If you prefer using the older graphs (they seem to work better on mobile devices), please choose Graphing->Fixed Graphs.
If you are using Graphing->Interactive Graphs, you zoom in by clicking and dragging (either horizontally or vertically). To get back to the original picture, double-click on the graph. You’ll note that you can now move your mouse over the graph and see what the values of your graphed lines are at any point.
In addition to these overarching upgrades, we’ve rolled out a number of new features:
- There is a new “Logs” menu, where Maintenance and Fuel information may be stored. We strongly recommend that you get in the habit of recording all maintenance events (emptying ash bins, cleaning boilers, repairing x part…) and leaving a note about what was done or seen. A picture is worth a thousand words, so we’ve made it easy for you to upload pictures associated with a maintenance event. Before and after pictures are good here.
- The Fuel page is useful to record all fuel deliveries to the facility, whether they are biomass or fossil. Tracking them in one location will allow us to help you know when to schedule your next delivery.
- As I just said, a picture is worth a thousand words. (Here are a few more words!) There is a new Plant menu, where you are given the opportunity to upload images (jpg or png) of your plant. This is a good place to put an as-built diagram, photos of key portions of the boiler plant, etc. For the time being, the name of the picture remains the same as it is on your computer. If you want a descriptive name, please name it before uploading.
- The Performance page has been dramatically expanded, showing key performance metrics in tabular form (as before) but also performance measure in two full plots (scroll down to see both plots). The lower plot contains histograms of boiler operation. For example, you may find that in the last week, your boiler spent 50% of its heating time with its control variable in the range 50-60%. The residual oxygen content may show a nice bell curve centered over the target value. It may not—why? Also plotted are the same type of histograms for your boilers for the previous month (the period between 30- 60 days ago). Perhaps you made some changes in your boiler’s configuration. You may see the shape of the histogram change dramatically as a result. Are your boilers short- cycling? Check out the top plot.
- When you are studying the performance of your boiler(s), you need to know about everything that may be affecting the performance. For this reason, if there are any parameters that have been changed in the time period you are looking at, a vertical black line will appear on the graph to alert you that something was changed then. You can then go to Data Tables -> Complete Data -> Parameters to see what changed. Likewise, any recorded cleanings are noted on the graph on the day they were done.
- In the Parameter view page, we’ve added the possibility of viewing all parameter changes occurring between certain dates (this is where you come if you’ve just seen a vertical black line in your graph). The set of buttons on the top now looks like:
 When the enter button is present on the screen, you need to press it (or hit “return”) to make any of your changes take effect.
Please explore the new BoilerBrowser and do let us know if you have any difficulties or suggestions for making it better. Many of the ideas for these new features came as suggestions from our users—thank you!
Contact email for suggestions and questions: techsupport@dcmlogic.com
-
The Maintenance Log
The Maintenance Log is a handy way for everyone caring for the boiler to log information in a single place.
-
Summary Page Update
We’ve changed the Summary page to allow you to click through on Faults and to see whether there have been parameter changes in the last 24 hours:
-
GraphShare™
Take a look at our newest feature on the BoilerBrowser—GraphShare™:

